Business Process Analysis
This section presents the technical analysis of the proposed First Solar process design. The focus is on demonstrating practicality, operational logic, and business viability through discrete-event simulation and sales strategy analysis.
All findings are presented in an objective format suitable for upper-management review and are supported by process modeling and Power BI visuals.
Discrete-Event Simulation Flowchart
A discrete-event simulation model was designed to represent the proposed First Solar production and fulfillment process. Discrete-event simulation is appropriate because the system changes state when specific events occur, including demand forecast receipt, procurement completion, production scheduling, quality review, and delivery confirmation.
The simulation begins with market demand forecasting and continues through raw material procurement, inventory verification, production scheduling, thin-film module manufacturing, quality inspection, packaging, distribution planning, customer delivery, sales data collection, and performance monitoring.
Figure 1. Event Simulation Flowchart
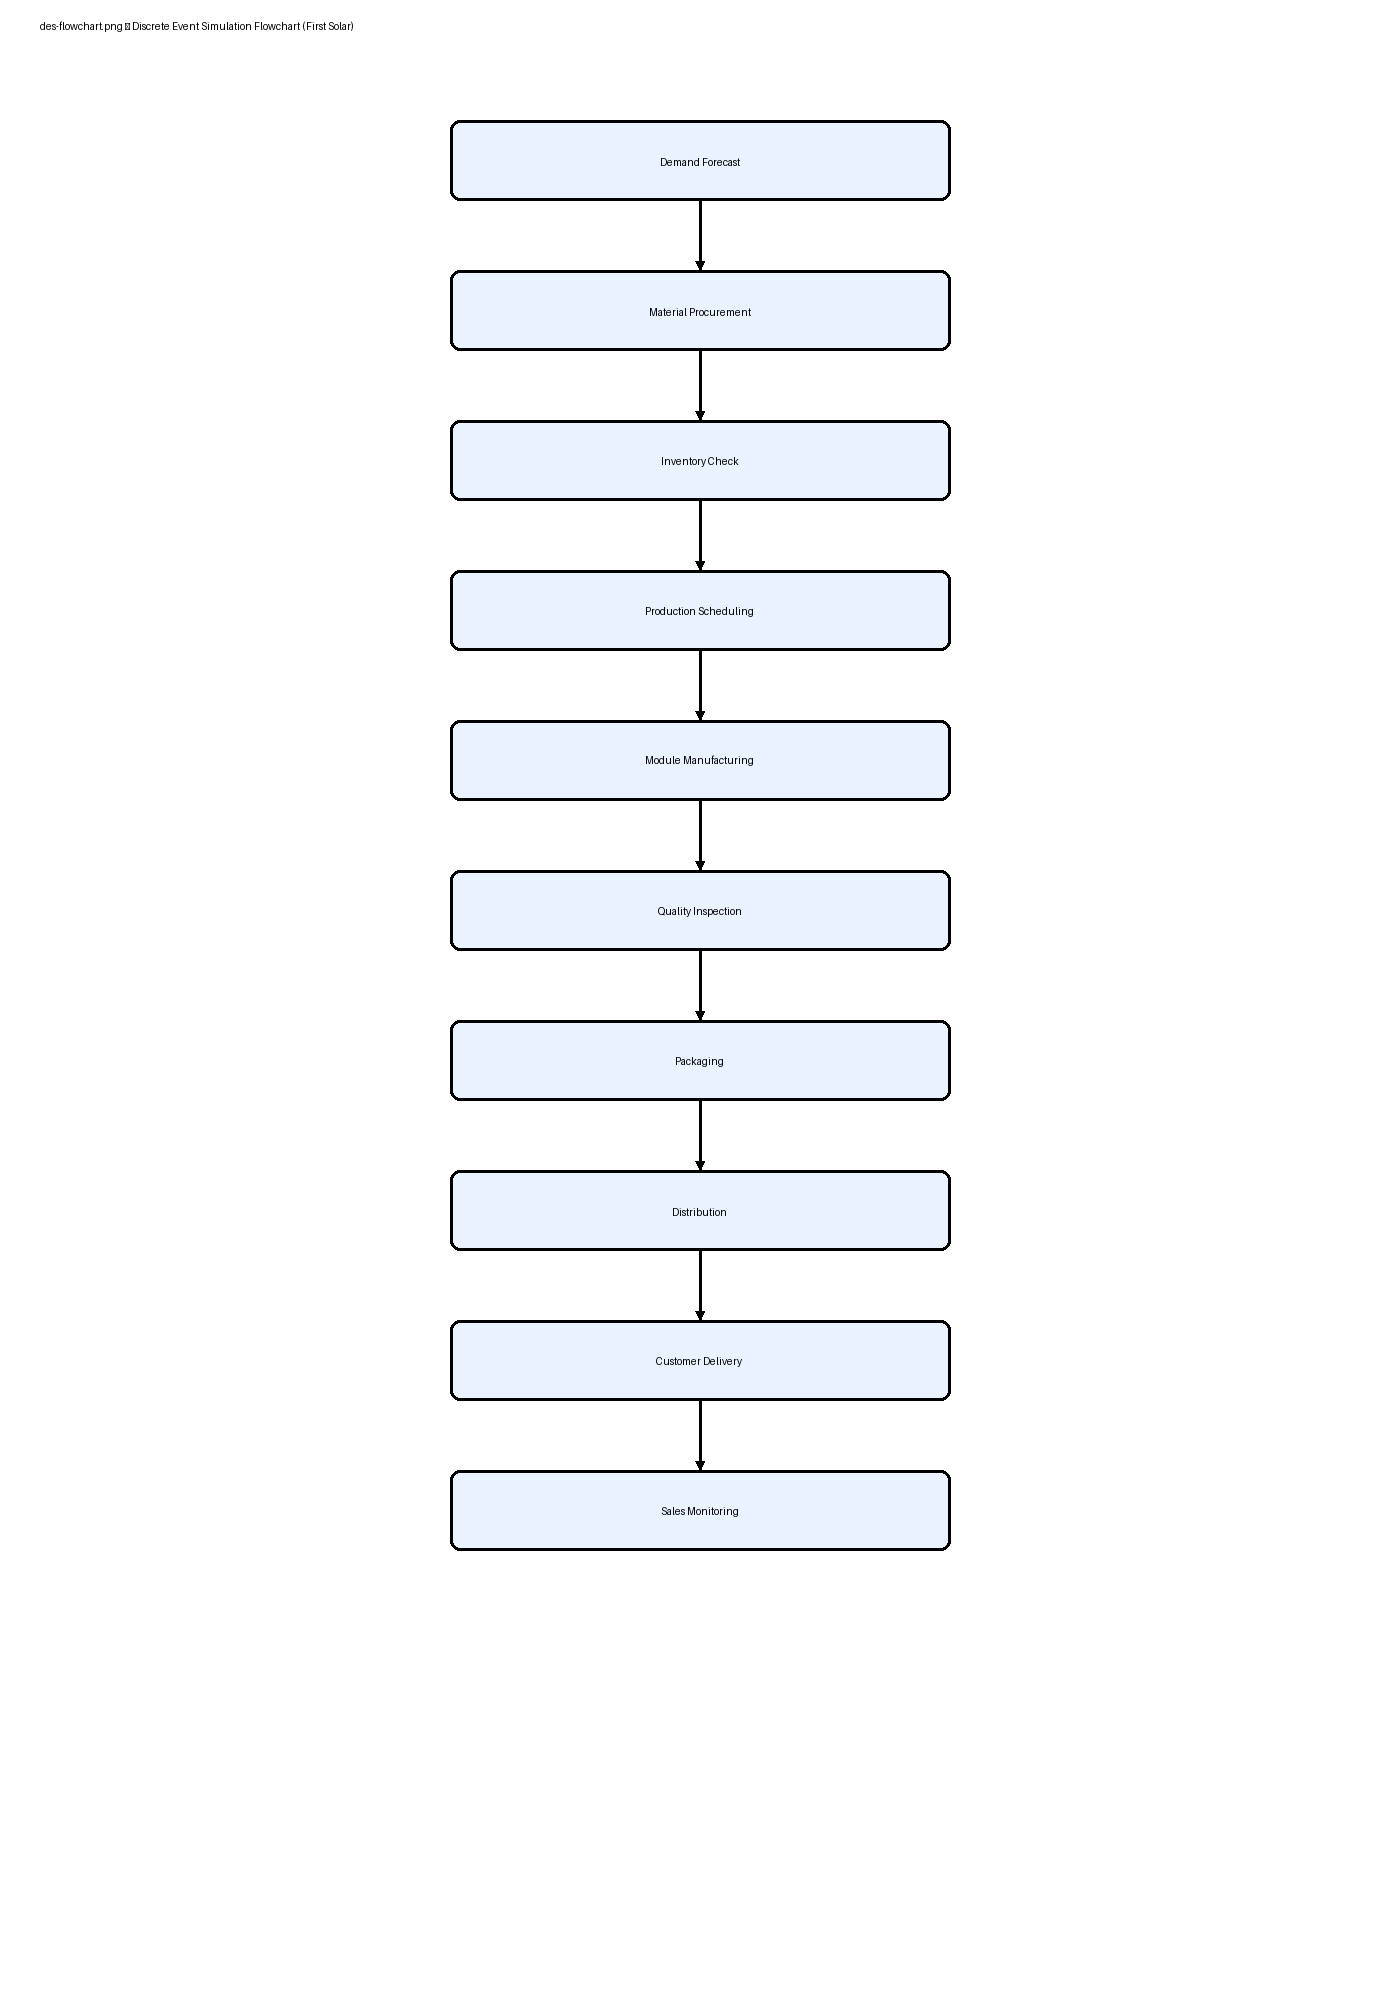
The event simulation flowchart illustrates the proposed production and fulfillment model, including decision gateways for material availability and quality acceptance.
Flow Logic Interpretation
The simulation model demonstrates that production performance depends on the timing and outcome of critical decision points. If materials are unavailable, the workflow cannot advance to production scheduling. If product quality does not meet required standards, the process must re-enter corrective handling stages before customer delivery can occur. These decision gateways establish the cause-and-effect logic needed to evaluate process feasibility.
Sales Strategy and Sales Analysis
The sales strategy associated with the proposed process model is based on reliable manufacturing output, improved fulfillment consistency, and stronger market positioning. The proposed model supports sales growth by reducing process delays, improving product availability, and increasing confidence among commercial buyers and energy developers.
A sales analysis was performed using projected data and probability-based scenario modeling. The estimated probability of a high-demand scenario is 45%, the probability of a moderate-demand scenario is 35%, and the probability of a low-demand scenario is 20%.
Figure 2. Projected Demand Forecast
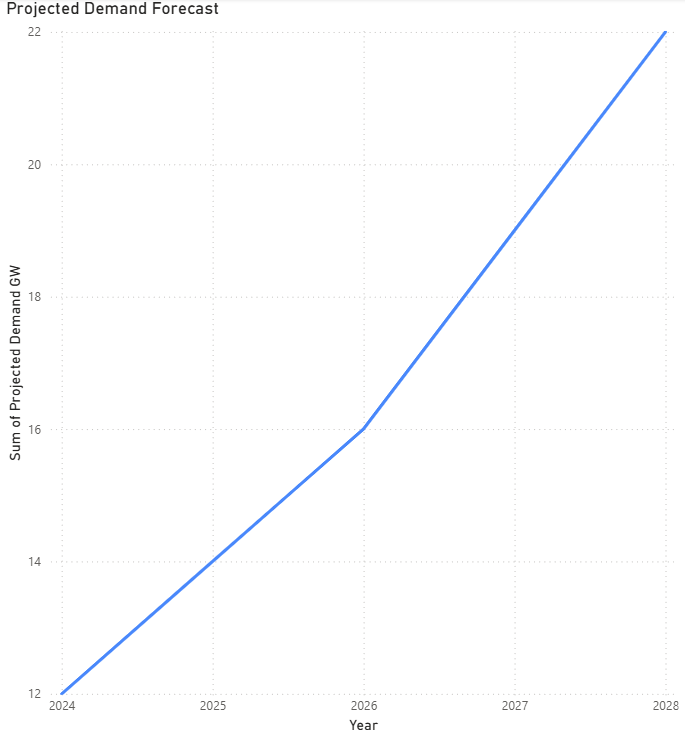
The projected demand forecast indicates sustained growth in solar module demand over the forecast period. This trend supports the assumption that operational improvements can be converted into measurable market opportunity.
Figure 3. Demand Scenario Probability Distribution
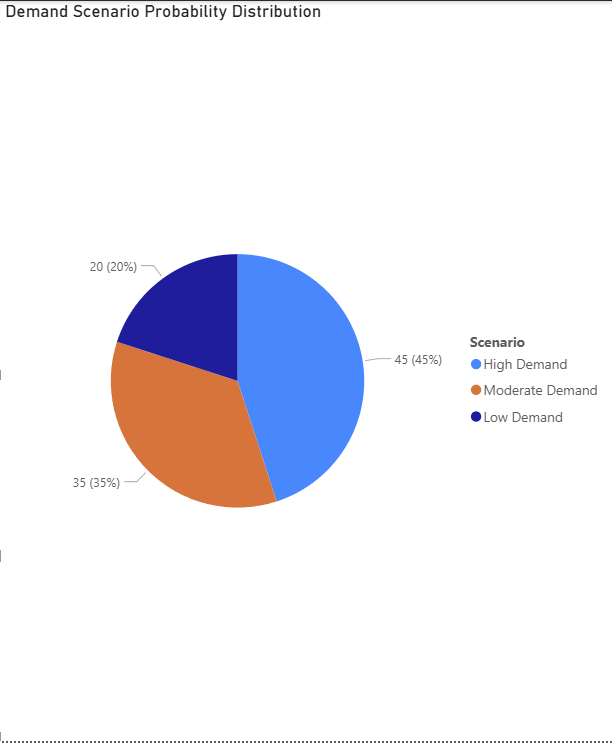
The demand scenario probability distribution demonstrates that moderate-to-high demand outcomes account for the majority of projected scenarios. This strengthens the justification for investment in a more reliable operating model.
Figure 4. Market Share and Sales Strategy Visualization
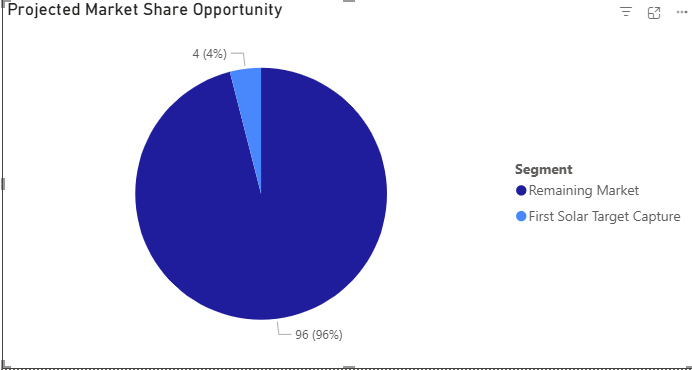
The sales analysis visual supports the proposed market strategy by showing how improved process performance can strengthen projected market position and revenue opportunity.
Probability Model Summary
Probability of success = (0.45 × High-Demand Outcome) + (0.35 × Moderate-Demand Outcome) + (0.20 × Low-Demand Outcome)
Based on projected operational improvements and demand assumptions, the estimated probability of achieving the target sales objective is 72%. This result suggests that the redesigned business model is not only feasible, but also analytically supported under likely market conditions.
Power BI Workspace
The interactive Power BI dashboard supporting this analysis is available through the Power BI Dashboard page.